One of my favorite Lovelace interface cards for Home Assistant is the mini-graph-card by kalkih. It’s the card running most of the graphs in our smart home‘s dashboard. Surprisingly, mini-graph card is actually not included in Home Assistant by default – honestly, it should be, it’s so good – but you can easily install it using HACS. You can make both line and bar charts and customize them.
Full disclosure: As of 2025, I am an employee of the Open Home Foundation, the non-profit that owns and governs Home Assistant. This blog post was written before I started working there. My opinions on this blog are my own and do not reflect the views of the foundation. Any recommendation of products here is of a personal nature and does not signal approval by the foundation.
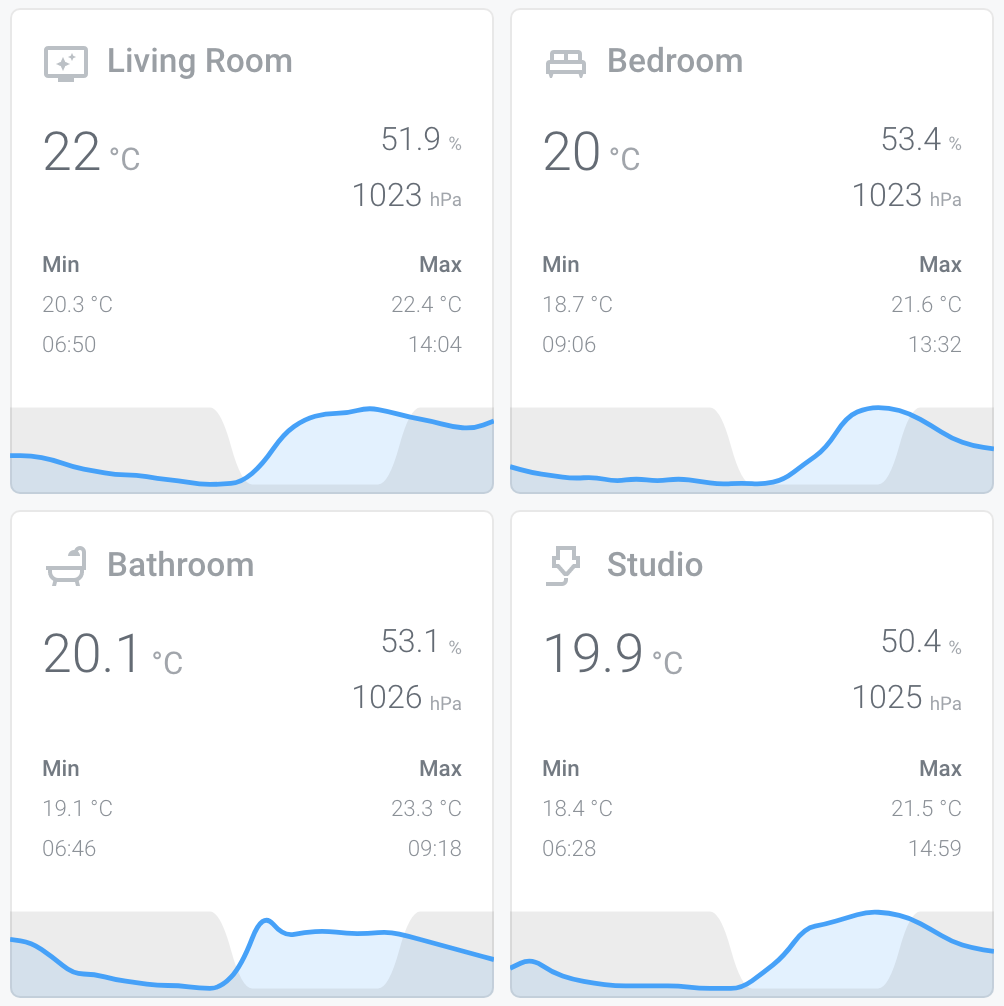
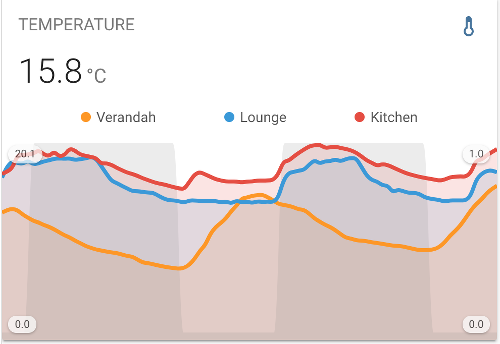
A recurring question that people ask when they see our charts is how we get the shaded areas that indicate nighttime. It’s quite a handy feature, especially for sensors where the readings are influenced by time of day or the sun. Our temperature sensor graphs, for example, became a lot clearer when you immediately see how the temperature changes as the night moves into day.
The idea for the shaded night indicators wasn’t even my own, it’s a standard example from the mini-graph-card documentation. It’s just not explained very well in the documentation how to go from the example to actually implementing it in your Home Assistant installation.
The documentation does explain how to get the chart set up: you create a ‘fake’ secondary Y-axis with no line, points, or legend – just gray shading. To make this shading appear in our chart at the right times we simply need an entity that is set to 1 when it’s night and 0 when it’s day. Because no other data of this axis is shown, the night entity looks like gray shading overlaid onto our chart.
    - color: gray
      entity: input_number.nighttime
      name: Night
      show_line: false
      show_points: false
      show_legend: false
      y_axis: secondary
But what the mini-graph-card documentation does not explain is how to create the entity in Home Assistant that powers this night indicator. Turns out, it’s really simple. We can use Home Assistant’s built-in sun integration to detect when it’s night or day and use the templating engine to translate the integration’s sun.sun entity into a 1/0 night entity.
To do so, you have to edit your Home Assistant installation’s configuration.yaml file and add the following code:
This template creates a sensor.nightstate entity that will be set to 1 when sun.sun is below_horizon and 0 when sun.sun is not. That’s exactly what mini-graph-card needs to apply the night indicator shading.
Restart your Home Assistant for the template to load and if everything goes right, you should have sensor.nightstate available to you. As an example, the following code is what I use for my bedroom temperature card with night indicator shading:
Not too hard, right? Once you’ve got this set up you’ll start adding night indicators to all of your charts!
Hi Guy,
Very nice. Works perfect and looks beautiful. Thank you for this tutorial.
I have one thing i’m struggeling with a bit. How do you style the font-size different of the temperature and the humidity. I’m looking to have the temperature in a bigger font-size and the humidity in smaller?
// J
Hi Johan, thanks! I’m afraid that I don’t style my font-sizes separately in this card, I just use “font_size: 80” to make it smaller for all of them equally. That works out on all of the devices I view this card on.
Firstly thankyou for writing up the idea of shading to show time periods. I’m using it the other way to show when its day for solar panels, but:
I don’t think you need to create a sensor. There is already the sensor: ‘sun.sun’
True, that doesn’t return numeric values but in the mini-graph card you can map values:
state_map:
– value: below_horizon
label: 0
– value: above_horizon
label: 2
Overall its probably the same number of lines of code but using sun.sun and state_map keeps all the logic in the same place.
Good morning
I had done this function, but with the new template formatting, it no longer works…
What should we do now?
THANKS
Great, the newer version of Homeassistant needs a diffet kind over yaml code:
template:
– sensor:
– name: “Night State”
unique_id: nightstate
state: >
{% if is_state(‘sun.sun’, ‘below_horizon’) %}
1
{% else %}
0
{% endif %}
[…] Additionally, we use sensor.nightstate to shade nighttime in this card – details can be found here on how to set this entity […]